Looking to find out more about Event Related Potentials (ERPs)? Here is a breakdown of what an ERP is, how you can use it, and what the results of an ERP experiment mean.
What are ERPs?
In many psychology and neuroscience experiments, participants are presented with a stimulus or an event. Researchers use stimuli to trigger brain responses.
These electrophysiological responses are called Event Related Potentials (ERPs). Researchers can use both sensorimotor and cognitive stimuli to induce an ERP, and the stimuli can be internal or external.
Visualize event related potentials with EEG
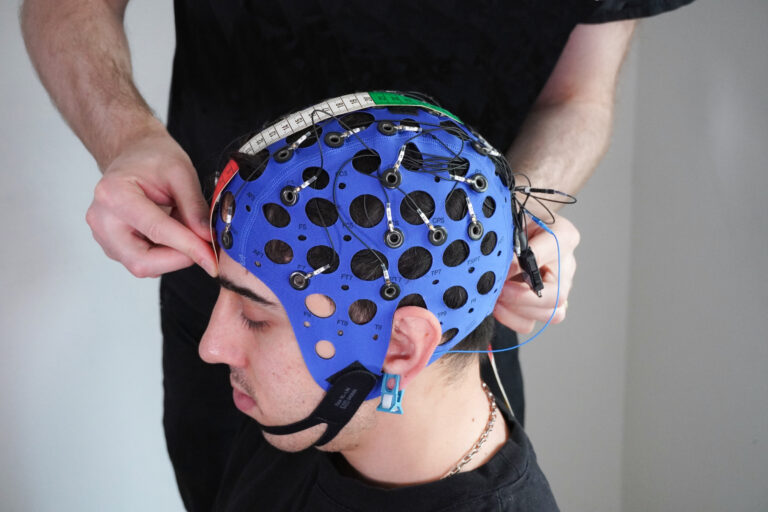
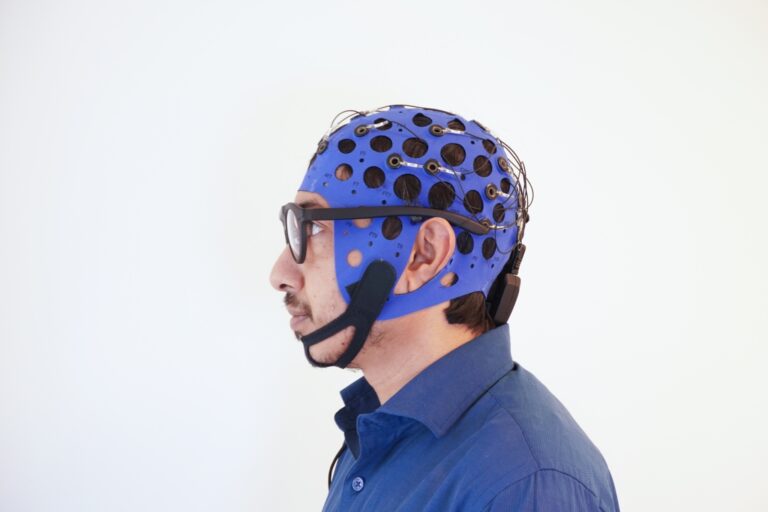
One of the best ways to see an ERP is via electroencephalography (EEG).
However, since EEG does not distinguish between event-related and non-event-related brain activity, and because EEG is prone to noise, we must pre-process data before looking at ERPs.
Find more about what EEG noise is and how to mitigate it in our article on how to reduce noise in EEG recordings.
To be brief, one of the easiest ways to minimize EEG noise is to perform multiple experiment trials with the same event and average the recorded signals. This technique averages away noise, without losing the signal.
P300 experiments
A very common and well-studied type of ERP is the P300 response.
P300 is part of a brain signal. It occurs in response to unexpected events. More specifically, it is the positive component of a brainwave, and usually emerges 300 milliseconds after a stimulus appears, hence the name: P300.
One of the most popular ways to elicit a P300 response is to use the oddball paradigm. Here, a participant is presented with a sequence of repetitive stimuli, and, occasionally, a deviant, target stimulus (Picton, 1992).

In general, non-deviant stimuli are presented 80% of the time, and deviant stimuli are presented 20% of the time. The stimuli can be visual, auditory, somatosensory or a combination of all three.
In the oddball paradigm, participants focus on stimuli, and count or press a button when a deviant stimulus appears. Deviant stimuli elicit P300 evoked potentials in parieto-central regions of the brain.
Notably, the amplitude of a P300 response is inversely proportional to the frequency of the deviant stimuli. It is also directly related to the discriminability of the deviant stimulus (Lindon, 2005).
Several studies have indicated that the latency and amplitude of a P300 response can be used as a biomarker for many psychological and neurological conditions, including depression, schizophrenia and neurodegenerative disorders.
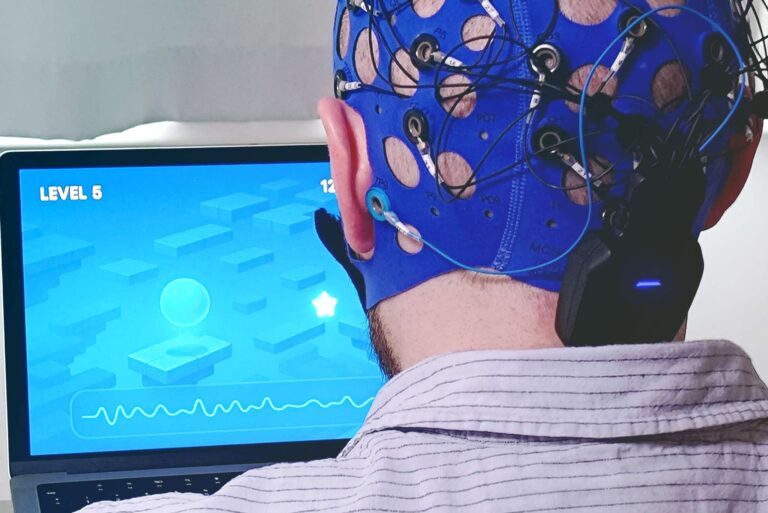
In the BCI community, P300 is widely used in spellers, brain painting, gaming and VR-based BCIs (Fazel, 2012).
Designing a P300 experiment
Here, we implement a simple, visual oddball experiment. Participants are presented with two stimuli. The default stimulus is a blue rectangle, while the target, deviant simulus is a red oval.
The deviant stimulus appears 20% of the time, and when it does, the participant must press a spacebar.
Trials are grouped into blocks, so that the participant has an opportunity to rest. Stimuli display for 500 milliseconds, with a 600 millisecond interval between them. These parameters, as well as the number of blocks and trials can be changed in the experiment script (lines 13-16).
The following figure illustrates a trial in which three default (blue) stimuli display, before a deviant (red) stimulus appears. The deviant stimulus is followed by another default stimulus.

The order of the stimuli changes randomly in each trial, but the ratio of default to deviant stimulus remains constant (80% and 20% respectively).
We record EEG and mark the stimulus onset and spacebar presses in the dataset.
To do this, we use an 8-channel Mentalab Explore device with dry electrodes. We place the electrodes, numbered 1 to 8, on TP9 (left mastoid), Cz, Pz, CP1, CP2, P3, P4 and Oz respectively. We place the ground electrode on the right mastoid (TP10).
If you would like to change the electrode positions, change the labels in the code here.
The experiment script generates three CSV files containing EEG, movement and marker data. The script records trial start-time in the marker file, and stimulus type in the marker code.
Analyzing the P300 results
To analyze the data, we wrote an analysis script. The analysis script loads the EEG signal and markers, applies notch and bandpass filters, and extracts the epochs using the timestamps of the event markers.
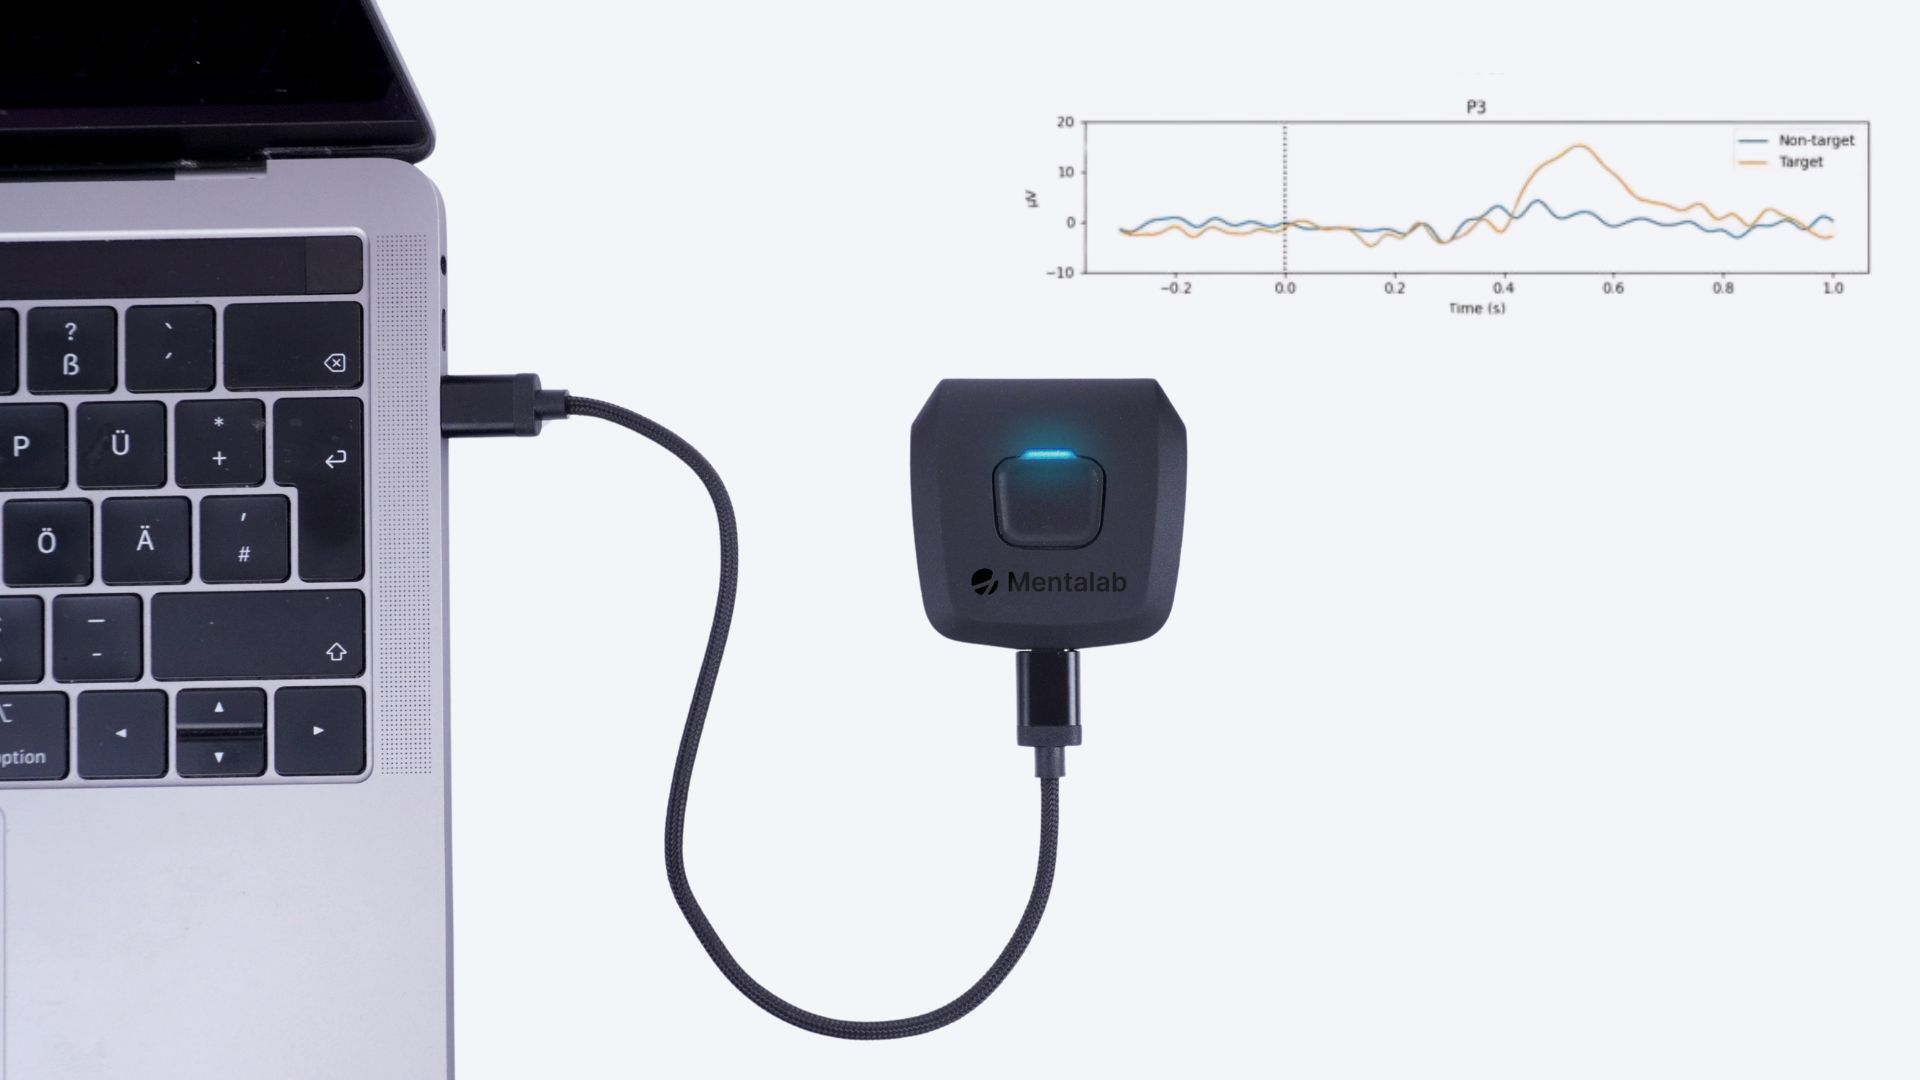
The script rejects bad epochs using a peak-to-peak amplitude criteria and then averages epochs that have the same type of stimulus. The following figure depicts the ERP waveforms for each channel.

You should be able to see the positive (ERP) component in the deviant (orange) trials, in comparison to the flat curves of the default (blue) trials. The peak of the P300 occurs around 500 milliseconds after stimulus onset.
There is no ERP in the TP9 channel, as expected.
Finally, we plot ERP images using EEGLAB. Here, the plots show the waveforms for each trial. There is no significant jitter in the signal transmission. However, because of environmental factors, there is a slight Bluetooth delay, which is why the P300 peaks are a little later than 300 millseconds.

Conclusion
Mentalab Explore is suitable for ERP experiments. Using dry electrodes, we used software-generated event markers (instead of physical triggers) to keep track of P300 responses, which are clearly visible in the ERP plots.
This setup allowed us to run experiments in a completely mobile setup, without wiring the Mentalab Explore EEG device to a trigger box. All the code and instructions to run the experiment are available in our GitHub repository.
We are happy to discuss your ideas and provide guidance on how to use our application code. If you’d like to learn more, please contact us at
References
Fazel-Rezai, R., Allison, B. Z., Guger, C., Sellers, E. W., Kleih, S. C., & Kübler, A. (2012). P300 brain computer interface: current challenges and emerging trends. Frontiers in neuroengineering, 5, 14. https://doi.org/10.3389/fneng.2012.00014
Linden D. E. (2005). The p300: where in the brain is it produced and what does it tell us?. The Neuroscientist : a review journal bringing neurobiology, neurology and psychiatry, 11(6), 563–576. https://doi.org/10.1177/1073858405280524
Picton T. W. (1992). The P300 wave of the human event-related potential. Journal of clinical neurophysiology : official publication of the American Electroencephalographic Society, 9(4), 456–479. https://doi.org/10.1097/00004691-199210000-00002